
- 3 Linear Regression
- 4 Classification
- 5 Resampling Methods
- 6 Linear Model Selection and Regularization
- 7 Moving Beyond Linearity
- 8 Tree-Based Methods
- 9 Support Vector Machines
- 10 Unsupervised Learning
3 Linear Regression
3.0 Introduction
3.1 Simple Linear Regression
3.2 Multiple Linear Regression
3.3 Other Considerations in the Regression Model
3.4 The Marketing Plan
3.5 Comparison of Linear Regression with K-Nearest Neighbors
4 Classification
4.0 Introduction
4.1 An Overview of Classification
4.2 Why Not Linear Regression?
4.3 Logistic Regression
4.4 Linear Discriminant Analysis
4.5 A Comparison of Classfication Methods
5 Resampling Methods
5.0 Introduction
5.1 Cross-Validation
5.2 The Bootstrap
6 Linear Model Selection and Regularization
6.0 Introduction
- Why would we use alternative fitting procedures instead of least squares?
- Prediction Accuracy:
- n » p: low bias
- n not much larger than p: easily overfitting, high variance
- n smaller thatn p: least squares not feasible
- alternative procedures could decrease variance with negligible increase in bias
- Model Interpretability:
- unnecessary variables lead to higher model complexity
- feature selection could remove these variables_Subset Selection_
- Prediction Accuracy:
- The difference between Subset Selection, Shrinkage, and Dimension Reduction?
- Subset Selection: fit a model involving a subset of p predictors; computationally inefficient
- Shrinkage: fit a model involving all p predictors; computationally speaking, almost the same as least squares
- Dimension Reduction: fit a model involving M projections of p predictors
- Is Subset Selection equavalent to feature selection? Then what about lasso?
- No. Subset Selection could do feature selection, lasso could also do feature selection. But Dimension Reduction is not a feature selection method.
6.1 Subset Selection
- The pros and cons of Best Subset Selection, Forward Stepwise Selection, and Backward Stepwise Selection?
- Computationally: Best Subset Selection is more time-consuming.
- Backward Stepwise Selection is not feasible when n « p.
What is Forward Stagewise Selection’s essence? Is it similar to Partial Least Squares?
- Two ways to estimate test error.
- Adjust training error to account for the bias due to overfitting.(why not the variance due to overfitting)
- Validation set approach and cross-validation approach.
- The comparisons and ituitions of the four criteria.
- BIC places heavier penalty on model complexity than C_p.
- RSS could be replaced with deviance for general cases.
- RSS/(n-d-1) intuitively controls the involvement of unnecessary variables. Once all necessary variables have been included, adding extra features would increase the denominator while little decrese in the nominator.
- Comparison between the two testing error estimation?
- Validation and cross-validation make no assumption of the model, more general.
- The point behind one-standard-error rule?
- Parsimony
6.2 Shrinkage Methods
- The idea of shrinkage?
- shrink the coefficients to zero, and thus reduce the variance
- Standardization?
- standardize before ridge regression(certainly, PCR as well)
- PLS
- lasso needs standardization too?
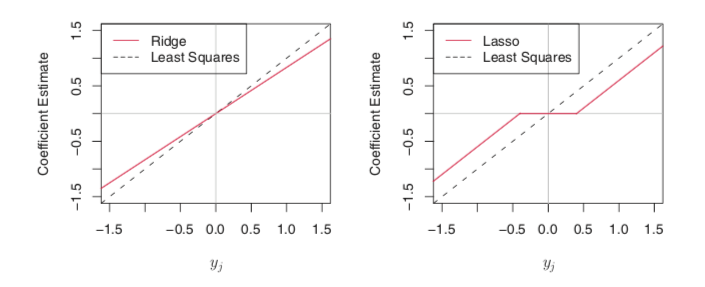
- Ridge regression’s pros?
- bias-variance-tradeoff
- works best when least squares estimates have high variance
- for least squares, n > p: low bias, high variance; n < p: no unique solution. While ridge regression works in both situations.
- Comparison between ridge regression and lasso?
- none of the coefficients of ridge regression is exactly zero, which might lead to interpretability problem, while lasso would shrink some coefficients to exact zero and do feature selection.
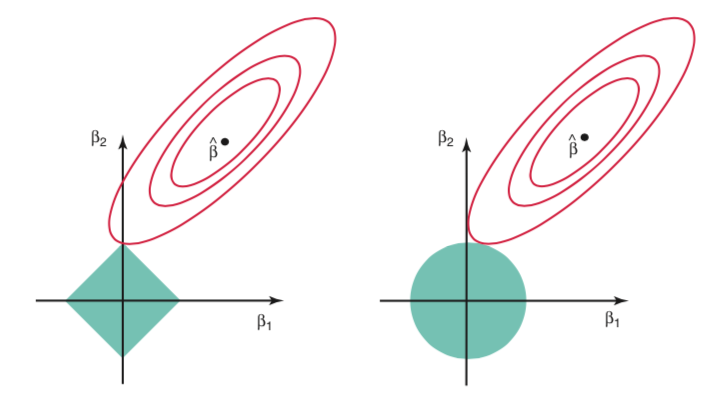
- Graphical intution of these two methods.

- lasso performas better when the true model only depends on a small amount of predictors.
- ridge regression shrinks all coefficients by the same proportion while lasso shrinks most of the coefficients by similar proportion and sufficiently small coefficients directly to zero. Recall the illustrating graph.
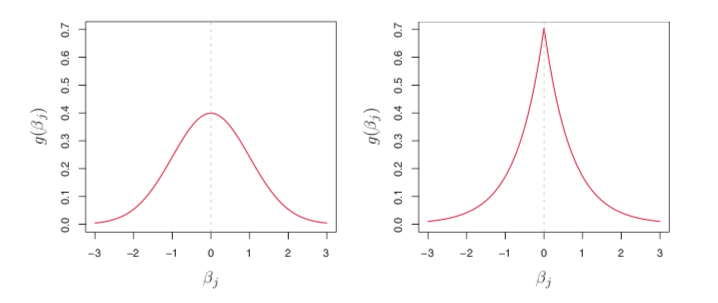
- Bayesian interpretation:
- ridge regression <-> Gaussian prior, thus shrinked coefficients vary around zero
- lasso <-> Laplace prior, thus shrinked some coefficients to exact zero
6.3 Dimension Reduction Methods
- The idea of Dimesion Reduction?
- constrain through the form of the coefficients
- The idea of PCA?
- first principle component shows the largest variability of predictors.
- it summarizes the predictors.
- The assumption of PCR?
- assume that the directions which the predictors shows the most variation are the directions assocaited with the response.
- PCR and ridge regression?
- They are closely related. When the true model relies on a small set of the original features, PCR and ridge regression may not perform well.
- ridge regression, continuous version of PCR. small lambda <-> large M
- The idea of PLS?
- why call partial least squares? what’s the connection with least squares?
- cons of PCR: The directions that best explain the predictors doesn’t guarantee to best explain the response. So, PLS intends to use the response Y’s information, a supervised version of PCR.
- the interpretation of the new feature selection procedure, from the aspect of information?
- Does PLS negelct the information which reflects the most variation of predictors?
- We can consider these two dimension reduction methods identifying new features from different aspect of viewing the problem. PCR identifies new features reflecting the most variation while PLS identifies new features that relates both X and Y most.
6.4 Considerations in High Dimensions
- The problems of high dimensions
- Regardless of whether or not there truly is relationship between response and predictors, in high dimensional case, least squares will yield the coefficients that make a perfect fitting, namely RSS=0, and thus overfitting.
- Including additional variables leads to a vast increase in the variance of coefficient estimates.
- Those four criteria to select models don’t work here.
- Multicollinearity is extreme. Thus we cannot identify which feature is truly predictive of the response. There are many different models reaching the same prediction.
- What is the curse of dimensionality?
- Adding signal features that are associated with the response will improve the fitted model while adding noise features that are not associated with the response will deteriorate the model, leading to high variance of the coefficient estimates.
- Several points to notice in high dimension
- Traditional measures of fitness could not be used to demonstrate the performance of high dimensional models. Use independent test set or cross-validation instead.
- When we have got a model, we need to know that it is only one of the many possible models for prediction, and it requires further validation.(corresponding to the 4th problem of high dimensions.)
7 Moving Beyond Linearity
7.0 Introduction
Chapter 6 improves model by reducing model complexity and is still in the framework of linear assumption.
7.1 Polynomial Regression
- The individual coefficients are not of particular interest, and the point is to understand the relationship.
7.2 Step Functions
- Pros and cons of step functions?
- pros: Polynomial Regression imposes a global structure on the non-linear function of X, while step functions do not.
- cons: can easily miss the pattern of the relationship
- The idea of step functions
- Convert a continuous variable into an ordered categorical variable, K + 1 dummy variables.
- can take it as piecewise-constant regression
- The interpretation of the coefficients
- beta_0
- beta_i (i >= 1)
- Why is step functions popular in biostatistics and epidemiology? Do these field have knowledge of the natural breakpoints?
7.3 Basis Functions
The relationship between Basis Functions and Polynomial Regression and Step Functions?
Note that it still use the linear regression framework.
7.4 Regression Splines
Definition of knots?
- The difference between piecewise polynomial regression and regression splines?
- regression splines satisfies the constraints on continuity and derivative continuity.
- How to understand smooth?
- In Mathematics, a smooth function is infinitely differentiable. However, in computer science, only several level of differentiable is required.(Still not sure.)
The definition of a degree_d spline?
- Would continuity in derivatives at degree k automatically satisfies continuity at lower degree of derivatives?
Despite of the performance at the boundaries, given the same degrees of freedom, is Regression splines superior to Polynomial Regression? Would it be more stable in other ranges?